NDP: The Alternative to GDP
December 14, 2020 13 minutes • 2656 words
Table of contents
Supereconomics uses Purchasing Power as its alternative to GDP, as explained in The Digression on the Value of Silver of the Wealth of Nations.
In that Digression, Adam Smith proved that money supply does not correlate with a society’s wealth or poverty. Instead, it is the money price of some rude produce relative to the main food grain (such as wheat) which is the clearest indicator of a society’s wealth or poverty.
For example, if a haircut is $3 when rice is $1 per kilo in normal times, then haircuts have a normal ratio of 1 : 3.
- If it goes up to $4 then it changes to
1 : 4. This indicates a decline in productivity which can be a sign of increased poverty. - If it goes down to $2 then it changes to
1 : 2. This indicates an increase in productivity which can be a sign of increased wealth.
| Economics | Supereconomics |
|---|---|
| Value of Economy = Quantity of Money | Value of Economy = Quantity of Effort to produce the same output, pegged to grain values |
The Digression on Silver
To prove that relationship, he had to write about:
- the price of wheat (food produce) from year 1262 to 1700
- the price of silver in the world and its ratio to gold (non-food produce)
- the nature of the price of other non-food produce
In the same way, we want to objectively prove that GDP (measured in US Dollars) is not a proof of the wealth of a country. Instead, it is the collective grain value that a society needs in order to gain possession of all the cars, iPhones, bus tickets, real estate, etc. in that society for a certain timespan.
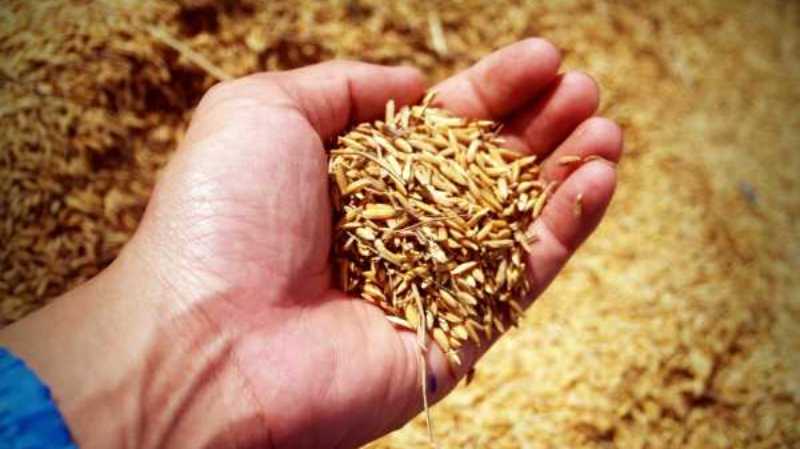
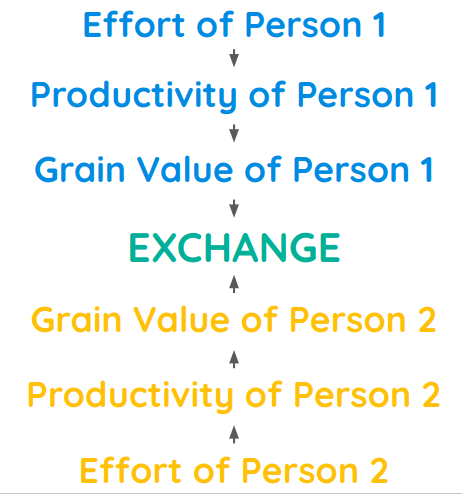
This grain value embodies the purchasing power of the society, ultimately representing their actual productivity which represents effort, as The Effort Theory of Value . We use grain because without food, no one can do work to mine metals, make cars, inspect real estate, code websites, build infrastructure, etc.
In a nutshell:
- Grain Value is Productivity in potential form
- Purchasing Power is Productivity in realized form
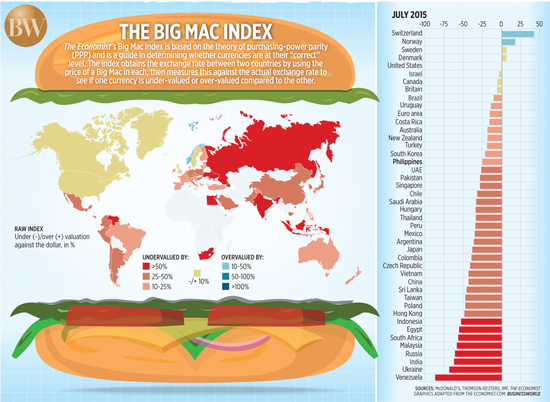
The purchasing power of a city or country is then compared to itself in the past, or with other cities or countries. In this way, we can more easily say whether the US, China, or the EU is really wealthier and which country’s wealth is based more on real value, instead of fake or nominal value.
Who wouldn’t want to live in a country that has more real value and is more resistant to economic crises?
The Net Domestic Product or NDP
The combined realized productivity of everyone makes up the Net Domestic Product or NDP.
We can say that the NDP is the the aggregate purchasing power of a society.
GDP or gross domestic product is the NDP that is combined with the effort needed to facilitate those exchanges, manifesting as the financial and insurance system.
We thus notate GDP as:
GDP = NDP + $
- NDP: Net Domestic Product
- GDP: Gross Domestic Product
- $: Gross Revenue of the entire financial system and insurance of a society
Money and finance are just tools to circulate real value as services (haircuts, cleaning, construction, utilities) and products (iPhones, potatoes, clothes). They are not real value or wealth themselves.
For example, a family has no internal financial system that charges the children a fee each time their mother cooks a meal for them. Instead, they pay back by getting good grades and doing as they’re told. Family life would actually be more difficult and unnatural if the parents imposed such a financial system.
The increase in economic difficulties in most countries are thus caused by the financial system growing more powerful. This is explained by financier Jeremy Grantham himself:
Ways to Get the NDP
There are 2 ways to get the NDP, just as there are 2 ways to get the GDP:
- Top-Down
- Bottom-Up
Top-Down
This approach deducts the effort of society in maintaing the money-system that circulates the real value between people. Currently, this effort manifests as the banking, financial, and insurance systems.
The expenses for finance charges, insurance premiums, interest payments, credit card annual fees, etc. all go as into the gross revenue of banks, fintech, and financial institutions. These do not affect the real economy in the sense that it does not matter whether a street bakery:
- had its equipment insured
- was banking with a large bank or small bank
- accepted major credit cards
All you need to know is:
- the price of their bread
- whether bread is available.
The financial system is therefore deducted from the GDP to arrive at the NDP roughly.
For example, the GDP or gross revenue of Singapore is nominally $323.9b. Its purchasing power would be the GDP minus the entire gross revenue of its financial and insurance systems for that year. This includes its social security and pension system.
Why do we need to deduct the entire financial revenue?
(Update Jul 2021)
Currently, GDP includes the revenue from financial activities, which Smith classifies as unproductive labor and can never be the solid foundation of any economy. Singapore, Hongkong, and Switzerland can base their economy on financial services because they are tiny countries serving global customers. Moreover, tax havens like the Bahamas are wealthy only because of tax evasion.
A recent proof is Lebanon’s GDP which was artificially propped up by state-run financial ponzi scheme. When that scheme collapsed, their GDP crashed to its real value suddenly, leading to instant unrest, violence, and death.
A larger example is the 2008 Financial Crisis that was left unchecked, as to lead to the Great Recession and secular stagnation.
An older example is the Mississippi Scheme by John Law in France.
An NDP system would expose the lack of real value in an economy immedately so that policymakers or the people can take appropriate measures, instead of being fooled into complacency and thinking that the economic future would be bright.
Bottom-Up
Governments will likely stick to the GDP system instead of excluding the revenue of its financial system. So we can build the NDP from the bottom-up by computing the actual purhases of people relative to the past and those of other countries.
For example, we can compare the value of the purchases of 5 people for this month with their purchases last month and last year. To eliminate the financial aspect, we measure the value in grains through a grain index, instead of money.
- If a kilo of rice in the Philippines is $0.75 and a kilo of chicken is $2.50 then 1 rice : 0.33 chicken.
- If a kilo of rice in Vietnam is $0.50 and chicken is $5, then 1 rice : 0.10 chicken.
| As of Q4 2019 | Philippines | Vietnam |
|---|---|---|
| 1 kg Rice can buy | 330 grams chicken | 100 grams chicken |
| 1 kg Chicken can buy | 3.33 kg Rice | 10 kg Rice |
This means that chicken is really cheaper in the Philippines. This means that while Vietnamese enjoy cheaper rice, Filipinos enjoy luxuries better (to Smith, meat is a luxury).
This is consistent if we replace chickens with cars. A Toyota Vios is 16,000 kg rice in the Philippines, but 44,250 kg rice in Vietnam.
This would then guide people on the socioeconomic condition of the cities or countries that they might want to move to, in order to match their social status. This fulfills the requirement of Adam Smith that our model must have a practical use.
The rich could use this to justify moving to Singapore, while the lower classes might use it to decide to live in the Philippines or Vietnam.
| As of Q4 2019 | Singapore | Philippines | Vietnam |
|---|---|---|---|
| GDP per capita | $100,345 (1st place, 13x Vietnam) | $8,936 (2nd place, 1.19x Vietnam) | $7,510 (3rd place) |
| Rice Prices per kg | 75 US cents or 1.1 SGD (2nd place or 1.5x Vietnam) | 80 US cents or 40 PHP (3rd or 1.6x Vietnam) | 50 US cents or 12k VND (1st place or cheapest) |
| Chicken Prices in rice | 4.22 kg rice (2nd place or 1.3x Philippines) | 3.25 kg rice (1st place) | 8.33 kg rice (3rd place or 2.56x Philippines) |
| Toyota Vios in rice | 73,636 kg rice (3rd place or 4.46x Philippines) | 16,500 kg rice (1st place) | 44,250 kg rice (2nd place or 2.68x Philippines) |
| Toyota Alphard Luxury Van in rice | 206,000 kg rice (2nd place or 2.25x Philippines) | 91,250 kg rice (1st place) | 336,000 kg rice (3rd place or 3.7x Philippines) |
Both Economics and Supereconomics will conclude that Singapore is the most prosperous country and Vietnam the least prosperous of the three from the supply side. But from the demand side, Supereconomics can reveal much more information:
- The poor of Vietnam are ‘wealthier’ than the poor of the Philippines (which is really the poorest)
- The middle class of Vietnam is the poorest of the three
- The rich of the Philippines are more prosperous than that of Singapore
- Because the poor benefit in Vietnam, the policies are likely pro-poor and anti-rich, consistent with Communism
- Because the rich benefit in the Philippines, the policies are likely pro-rich and anti-poor, consistent with oligarchy
So by combining GDP, Grain index, NDP and personal NDP, we can get a more granular picture of the real economic situation of a society. By plotting the ratios of prices of different products and services relative to the Grain index annually, we can:
- determine the economic direction of a society
- better iron out kinks in a society’s supply and demand
- plot the data backwards to show when the grain ratios started to change so that we can pinpoint specific laws that caused the problem or improvement.
Thus, by getting a country’s historical annual Supereconomic Purchasing Power, we can trace objectively when the oligarchy started in the Philippines and when Vietnam became anti-rich.
Pantrypoints
To simplify this system, we will use a platform called Pantrypoints that assigns grain value as points and aggregates the totals to automatically compute the NDP without going through the financial system.
Machine learning will then plot and project economic growth to help policymakers decide how to shape the economy.
Bye Bye GDP Problems
Our system allows everyone to know the real economic status of their city or country via the NDP.
This is different from Modern Economics which measures national wealth top-down through GDP and its sustainability through the CPI (consumer price index), both measured in currency.
GDP makes it difficult to value goods and services during bubbles and hyperinflation as what happened in Zimbabwe. If a financial crisis hits a supereconomy*, the valuation can merely switch to the Grain index to keep the supply chain humming.
*An economy that follows Adam Smith’s system
Under Economics, a country can theoretically have a single giant corporation exporting everything, having huge GDP while its workers starve to produce those exports at low cost. A GDP standard would still rate the starving country as wealthy. Countries even tweak their GDP numbers artificially to give an illusion that their economy is so good and their leaders are so effective.
Our NDP standard, on the other hand, would properly expose the real poverty hidden by the nominal wealth just as it exposed the hidden middle-class poverty in Vietnam and the real poverty in the Philippines.
Some organizations advocate a GDP 2.0 which measures income and other things. However, their flaw is that those are still measured in money which is volatile to begin with.
In contrast, our Grain index eliminates the need for complicated subjective factors that are present in other indices like the Human Development Index , Happy Planet Index , Better Life Index , etc. The subjectiveness is only in what items are pegged aganst the Grain index.
More importantly, our system cuts the cost of transactions while retaining democracy. It avoids degenerating into an arbitrary social credit system .
| _ | Economics | Supereconomics |
|---|---|---|
| Measure of Supply | GDP as Gross Domestic Product or the gross sales in a country | Purchasing Power as the net revenue in a country arrived at by a top-down approach (by deducting finance and money) or a bottom-up approach (by points through an app) |
| Measure of Demand | Consumer Price Index or prices of year X relative to year Y | Grain Index or prices of different goods and services relative to grain. For basics, it is fuel, electricity, water, rent, basic medical services and common non-essentials (meat, milk). For luxuries, it is cars, condominiums, etc. |
| Subjective Measures | Arbitrary, depending on think tank (Human Development index, Happiness index, etc) | Not-so-arbitrary. Measures are integrated in the items included in the Grain index. For example, a rich country might include prime beef and pork in the index, but a vegetarian country might not. In general, meat is included since Smith included it in his digression |
| Ease or Difficulty | Difficult, needs to get accounting of all output, and various data on well-being which are difficult to get | Easy, Survey the purchases done by a sample population, and get the prices of benchmark commmodities |
Update: July 2021
So What’s the Use of GDP in Supereconomics?
Since GDP will no longer be the measure of wealth, it becomes a measure of the velocity of an economy or how fast the economy is going, or whether it is going forward of backward. It is an important part of the DCTI tool in the absence of a direct way to get the Purchasing power of everyone.
